


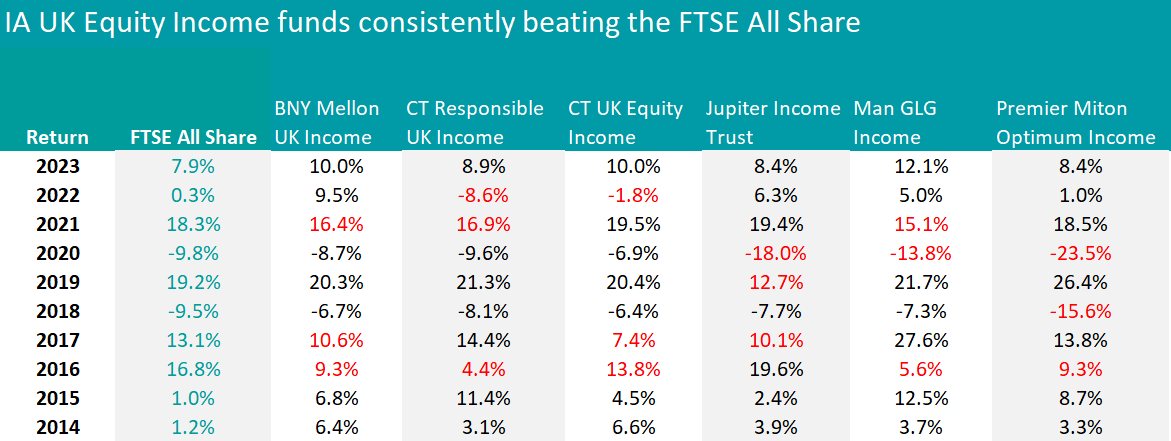
UK equity income funds found it more difficult than their counterparts to beat the most common benchmark in the sector, the FTSE All Share, in total return terms.
To prioritise dividends, income funds hold large companies that don’t invest as much in growth but rather distribute leftover cash to shareholders. The consequence is that this type of fund sacrifices a little bit of alpha in exchange for income.
It is not surprising, therefore, that no IA UK Equity Income fund managed to beat the most common benchmark of the peer group (the FTSE All Share) for more than seven of the past 10 years – but for this reason, it was an even greater achievement for the six funds that did.
The only investment house to have a duplet in the list was Columbia Threadneedle Investments, with the £3.3bn CT UK Equity Income fund and its £366m Responsible sibling.
The former is managed by Jeremy A. Smith, who invests for both capital growth and high yield, choosing stocks in any industry or economic sector. The biggest overweights are currently industrials (27.9%) and consumer staples (19.7%) and the main underweights are financials (9.3%) and energy companies, which the fund avoids. Its largest holding is Imperial Brands, which makes up 6.6% of the portfolio.
CT Responsible UK Income is led by Catherine Stanley, who avoids companies that don’t make positive contributions to society and the environment. Both sector weightings and top holding are somewhat different to those the Equity Income fund, as illustrated below.
Allocation of funds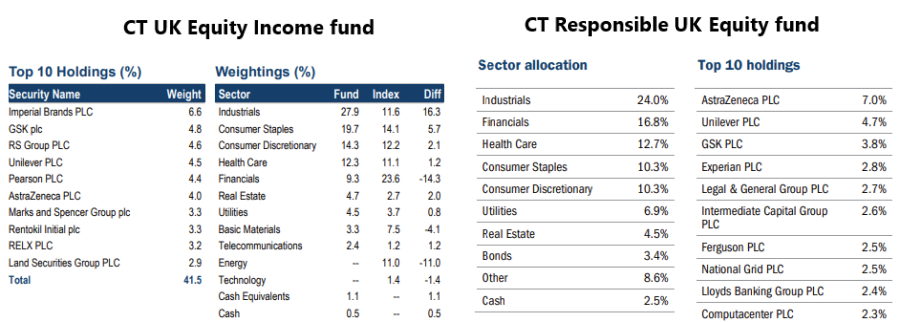
Source: Columbia Threadneedle
Next up is the £1.4bn Man GLG Income fund, managed by FE fundinfo Alpha Manager Henry Dixon. FE Investments analysts highlighted his “very disciplined” approach which has generated “strong capital appreciation as well as high levels of income, despite being often out of favour”.
“The shock of the Covid sell-off has led Dixon to improve the attention to businesses resilience, increasing the quality of the portfolio while preserving the low valuation discipline,” they said.
“The metrics used to assess the valuation of a company, as well as the fund’s exposure to bonds as a means of generating income, are key differentiating factors for the fund, as they are not widely used by other investors.”
Of the three remaining funds, BNY Mellon UK Income and Jupiter Income Trust are probably the more similar – they both have approximately £1.5bn of assets under management, a yield just above 4.3%, and they also are 93% correlated to each other (meaning that they rise and fall together 93% of the time).
They have similar allocations to financials (22%) and healthcare (8%), but otherwise differ in their exposures to basic materials (24.8% for BNY and 14.2% for Jupiter), consumer products (17.2% versus 26.9%) and industrials (19.8% versus 9.1%).
After 2020, the BNY Mellon fund pulled ahead of Jupiter Income Trust and in the past five years to today, it has more than doubled its competitor’s gains, returning 44.5% against Jupiter’s 20.5%.
Performance of funds vs index over 10yrs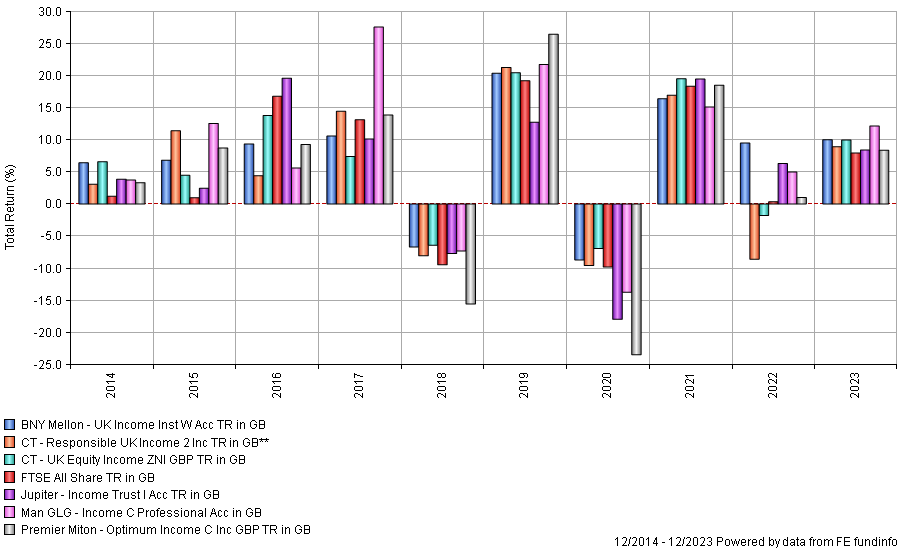
Source: FE Analytics
Finally, Premier Miton Optimum Income managers Geoff Kirk and Emma Mogford aim to deliver a 7% target annual yield (paid quarterly) – the current yield stands at 7.3%. To achieve this, they sacrifice some capital upside – despite still managing to beat the majority of their sector peers in total return terms.
The managers take a top-down, high-conviction approach, focusing on investing in quality UK companies that can generate dividend income, combined with a covered call overwriting strategy.
Source: Trustnet
This article is part of an ongoing series on consistency. Find the previous instalments here: IA Global, Europe, IA UK Equity.