


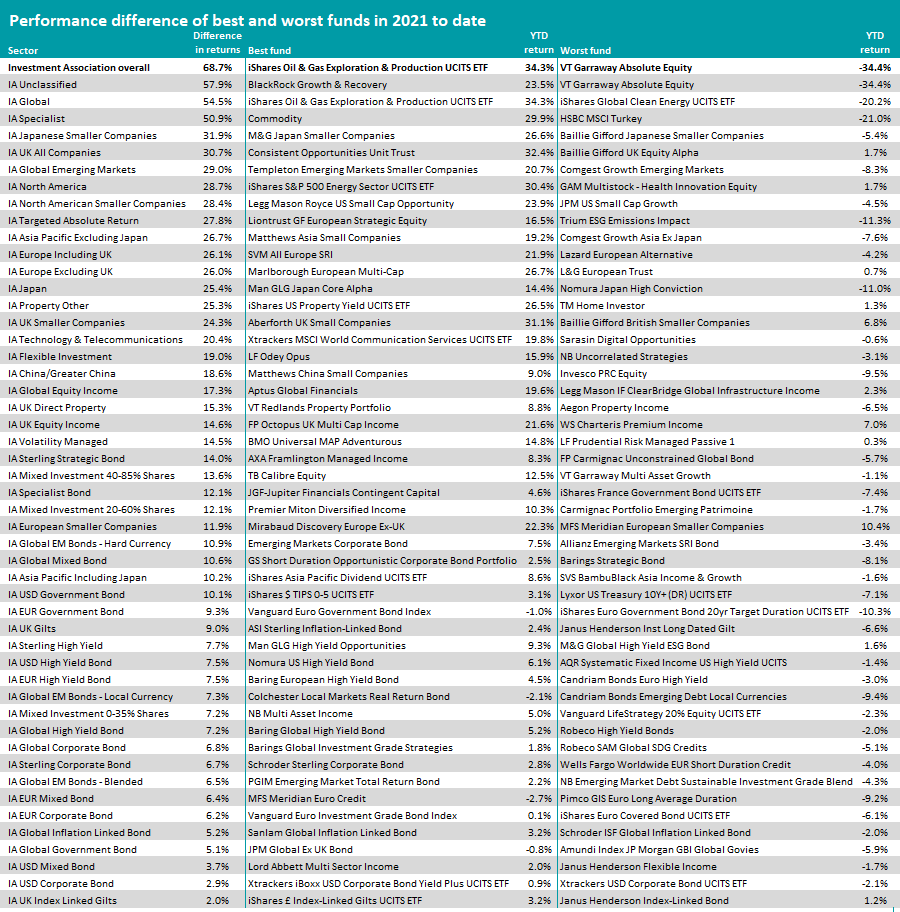
There is a gap of almost 70 percentage points between the Investment Association’s best and worst-performing funds over 2021 so far, Trustnet research shows. 
With a total return of 34.3%, iShares Oil & Gas Exploration & Production UCITS ETF has been the industry’s strongest performer over the year so far. This is down to surging commodity prices as the global economy starts to open up from 2020’s Covid lockdowns.
In stark contrast, VT Garraway Absolute Equity – which is in the process of being wound down – has shed 34.4% this year to become the worst Investment Association fund.
While there’s a 68.7 percentage point gap between the best and worst funds overall, the gap within individual sectors is smaller – but not by much.
Source: FE Analytics. Total returns performance from 1 Jan 2021 to 26 Jul 2021
As the table below shows, there’s a 57.9% difference between the best IA Unclassified fund (BlackRock Growth & Recovery) and the year’s weakest performer (VT Garraway Absolute Equity).
Of course, the very nature of this peer group means it is home to strategies that will vary widely in their investment universes and approaches, meaning there will also be a big difference in performance.
In second place, however, is the IA Global sector – which has been the main destination for investors cash over recent years. According to data from the IA almost £13bn has been added to the sector alone over the past 12 months.
The best performing IA Global fund over 2021 so far has been the aforementioned iShares Oil & Gas Exploration & Production UCITS ETF with its gain of 34.3%.
As companies at the front of the commodity value chain, exploration & production stocks tend to be tied to the price of the underlying commodity, which explains the strong performance of iShares Oil & Gas Exploration & Production UCITS ETF as oil soared in recent months, taking it 46.8% higher so far in 2021.
Performance of best and worst IA Global funds over 2021 to date
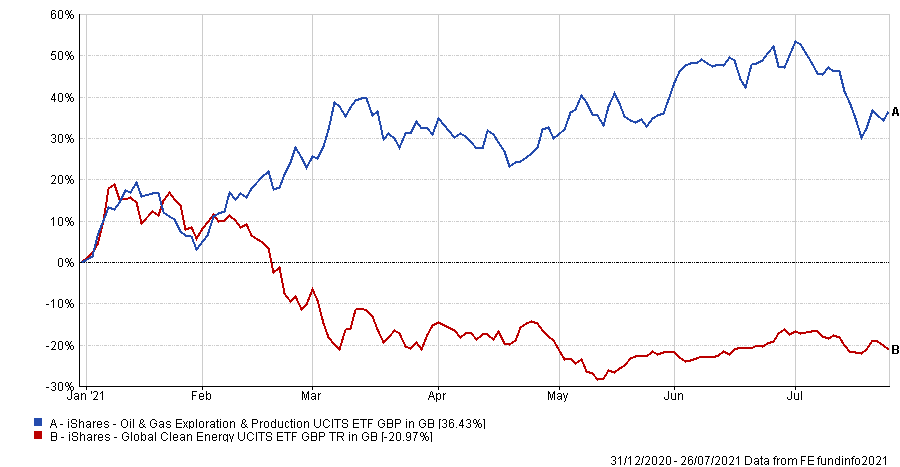
Source: FE Analytics. Total returns performance from 1 Jan 2021 to 26 Jul 2021
The worst performance of the IA Global sector over 2021 so far has come from iShares Global Clean Energy UCITS ETF. It lost 20.2% over this period.
After a strong rise in 2020, clean energy stocks have fallen out of favour as market leadership moved away from growth towards value – clean energy tends to sit in the growth bucket, while traditional energy stocks are seen as value plays.
The IA UK All Companies sector is another where there’s a large gap between its best and worst funds. Like many equity sectors, this is also down to the recent outperformance of value stocks.
Consistent Opportunities Unit Trust has made 32.4% over 2021 to date, putting it 30.7 percentage points ahead of the 1.7% made by Baillie Gifford UK Equity Alpha.
The £17.7m Consistent Opportunities Unit Trust has a value bias, looking for high-quality companies with strong balance sheets and stable market positions but trading at appealing valuations. While value investing had struggled for several years before 2021, it is important to note that this fund bucked this trend and was top quartile in 2019 and 2020.
On the other hand, Baillie Gifford UK Equity Alpha has a definite bias towards growth stocks in its portfolio. It tends to underperform when the market is being led by cyclical stocks in areas like energy, materials and banking, as is the case now, but has a strong long-term record thanks to a focus on long-term growth and mid-caps.
Other sectors where the best fund has beaten the worst by more than 25 percentage points this year include IA Global Emerging Markets, IA North America, IA Europe Excluding UK and IA Targeted Absolute Return.
When it comes to fixed income, there’s been a 10 percentage point or more gap between the best and worst funds in the IA Sterling Strategic Bond, IA Specialist Bond, IA Global EM Bonds - Hard Currency, IA Global Mixed Bond and IA USD Government Bond sectors.
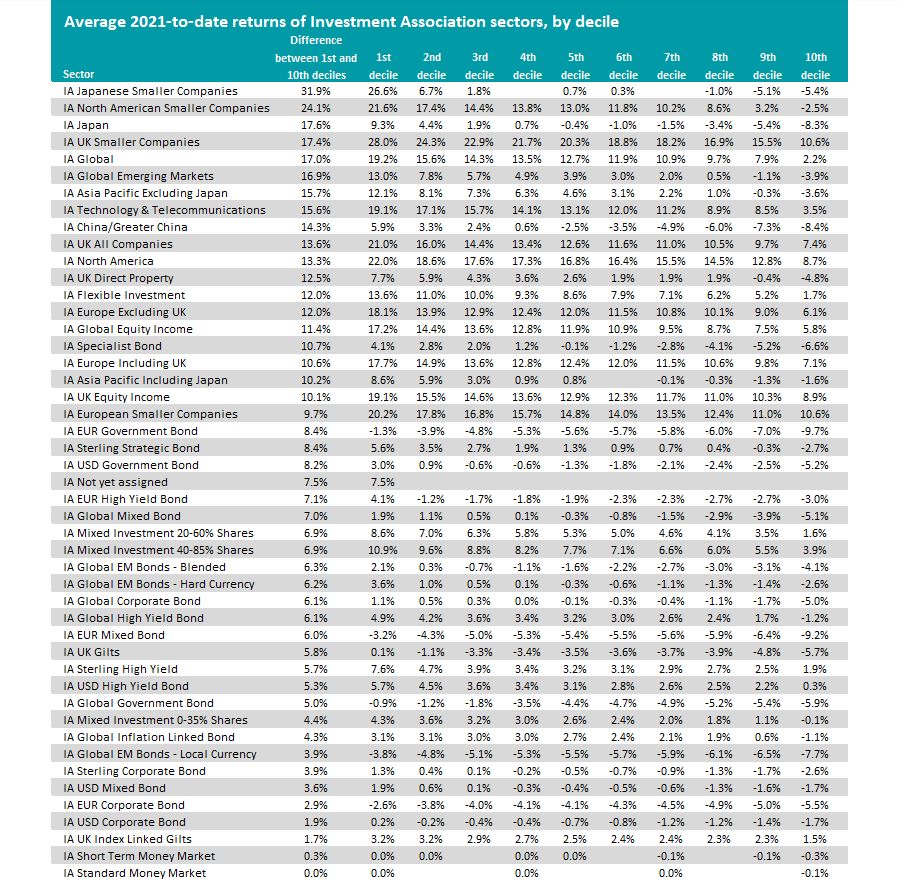
Of course, while the performance difference between the highest and lowest returners of a sector may be interesting, much of this gap is down to outliers making very high gains and those being hit by losses.
Therefore, we’ve also ran broken down the sectors by decile ranking, showing the average return made by the funds in each decile to reduce this ‘outlier effect’.
Source: FE Analytics. Total returns performance from 1 Jan 2021 to 26 Jul 2021
As can be seen from the above table, fund selection appears to have made the most difference in smaller companies funds, shown by the 31.9 percentage point difference in the IA Japanese Smaller Companies sector’s top and bottom deciles and the 24.1% gap in IA North American Smaller Companies funds.