


The number of active equity funds that are outperforming their average passive rival has slumped in 2021, Trustnet research suggests, following a strong showing in 2020. 
Last year proved to be one where active managers could demonstrate value, despite the crash of March 2020 in the early stages of the Covid-19 pandemic and the subsequent rebound on the back of massive amounts of monetary and fiscal stimulus.
In 2020, the average active equity fund outperformed its average passive peer in every one of the Investment Association’s 17 equity sectors – as shown in the chart below (which is ordered alphabetically).
Performance of average active fund vs average passive fund in 2020
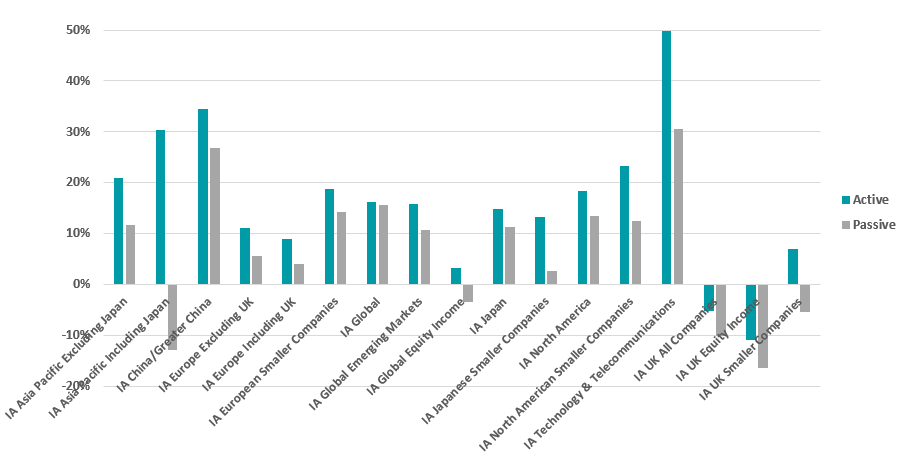
Source: FinXL
The equity peer group with the strongest active outperformance was IA Asia Pacific Including Japan, where the average active fund was up 30.38 per cent. This compared with a 12.82 per cent loss from the only tracker in the sector, meaning active outperformed by 43.21 percentage points.
Double-digit outperformance was also seen in the IA Technology & Telecommunications sector (active beat passive by 19.23 percentage points) and among smaller companies strategies – the average active fund was ahead of passive by more than 10 percentage points in the IA UK Smaller Companies, IA North American Smaller Companies and IA Japanese Smaller Companies sectors.
The IA Global sector, which has attracted the lion’s share of inflows in recent years, also saw its average active member beat passive. But active’s outperformance of just 0.57 percentage points meant it was the bottom-ranked sector.
Of course, average returns can be swayed by a small number of high performers, so we also looked at how many individual active funds in each equity sector outperformed the average passive in 2020.
The table below, which is ranked by the proportion of active funds that beat passive, reiterates how good a year 2020 was for active managers.
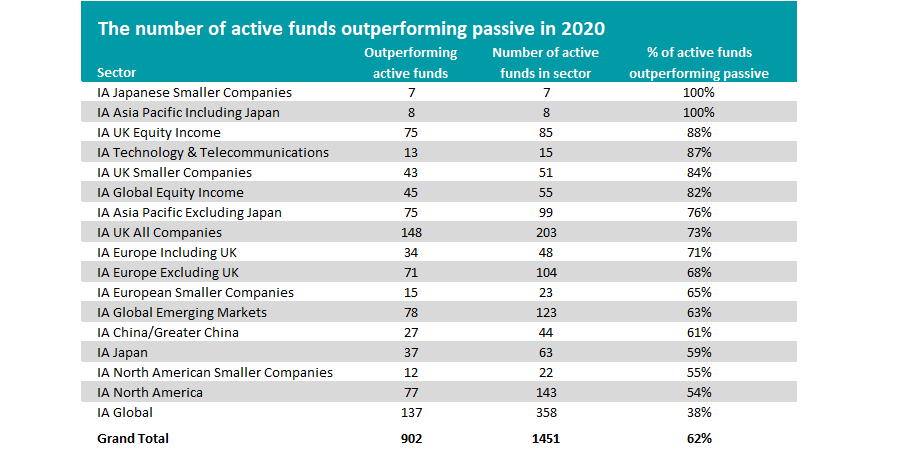
Source: FinXL
As can be seen, there are seven sectors where more than three-quarters of active funds made a higher total return than the average passive portfolio, including two where every active member was ahead.
There was only one sector where less than half of active funds outpaced passive last year.
While the obvious candidate is IA North America – the US market is a notoriously challenging one for active managers – 54 per cent of active funds outperformed there.
Instead it was IA Global – which has been the most popular destination for inflows for some time – where active struggled the most. Just 137 of 358 active IA Global funds – or 38 per cent – beat their average passive peer last year.
On the whole, however, active appears to have come out on top in 2020 as 902 of 1,451 active funds made a higher return than their average passive peer. That’s 62 per cent of the sample.
But the picture changes if we look at 2021, which many commentators have said could well be a year for active outperformance, due to challenges such as looming inflation and a reversal in market leadership.
Performance of average active fund vs average passive fund in 2021 to date
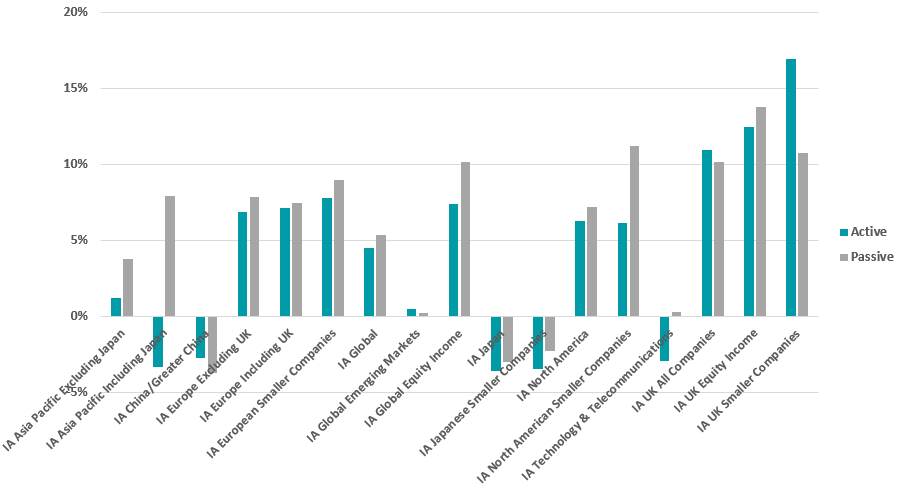
Source: FinXL, data as at 19 May 2021
Starting with average total returns, there has been a big slide in the number of sectors where active is beating passive. While all 17 equity sectors outperformed in 2020, the number has slumped to just four over 2021 so far.
What’s more, the level of outperformance leaves something to be desired.
There’s a relatively good result from IA UK Smaller Companies, the top-placed sector. Here, the average active fund’s 16.95 per cent total return is 6.22 percentage points ahead of the 10.73 per cent made by the sector’s only tracker.
But the average outperformance from the other three sectors is less than one percentage point: 0.93 percentage points for IA China/Greater China, 0.83 percentage points for IA UK All Companies and 0.28 percentage points for IA Global Emerging Markets.
In the remaining 13 equity sectors, investors would have been better off with the average index tracker rather than the average active fund.
The sector coming off worse is IA Asia Pacific Including Japan – which was the best area for active funds in 2020. This year, the average active member is down 3.34 per cent, putting it 11.27 percentage points behind passive.
A look at the number of active funds outperforming passive also reveals a similar slump.
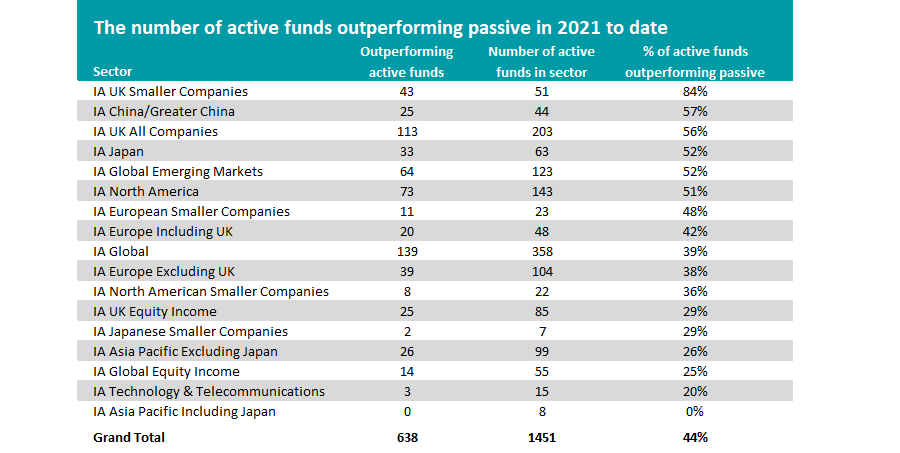
Source: FinXL, data as at 19 May 2021
This time around, only one peer group has more than three-quarters of its active funds beating their passive peers – IA UK Smaller Companies, with 84 per cent of active managers outperforming.
More than half of active funds are outpacing passive in another five sectors - IA China/Greater China, IA UK All Companies, IA Japan, IA Global Emerging Markets and IA North America.
But overall, it’s clear that active managers have handed back some ground to passive in 2021.
Of the 1,451 active equity funds we reviewed in this research, just 638 – or 44 per cent – have beaten their average passive peer over 2021 to date.