


More than half of the active funds in 33 sectors beat their benchmark in 2020, research by Trustnet has found, with some peer groups seeing almost every active strategy outperform. 
While last year’s coronavirus pandemic and global lockdown created some unprecedented conditions for fund managers to operate in, massive amounts of stimulus and the discovery of several effective vaccines meant it ended up being a positive year for most markets.
But how did active managers fare in this environment? In this research, Trustnet has compared the performance of every active fund in the Investment Association universe with its stated benchmark to determine if 2020 had been a successful year for active management.
Our research found that 1,426 of the 2,419 funds that declare a benchmark – or 58.9 per cent – made a total return that was higher than the index. This, of course, left 993 funds that failed to beat their benchmark.
While good news for active managers, 2020’s figures mark a slight retreat from 2019 when 61.6 per cent of Investment Association funds outperformed. But they are a significant improvement on 2018 – that year, just 32.9 per cent of funds made a higher return than their benchmark.
The sector with the greatest proportion of outperforming funds was IA UK Equity & Bond Income where all four of its members that state a benchmark - LF IM UK Equity & Bond Income, Threadneedle Monthly Extra Income, LF Canlife UK Equity and Bond Income and M&G UK Income Distribution – were able to beat it last year.
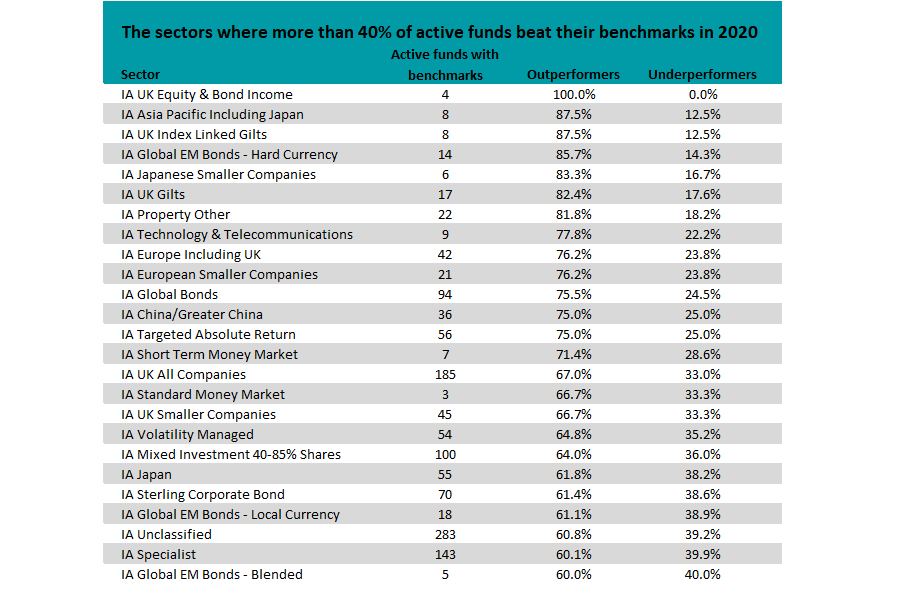
As shown in the table below, which reveals the 25 sectors where 60 per cent or more active members outperformed their benchmark, IA Asia Pacific Including Japan, IA UK Index Linked Gilts and IA Global EM Bonds - Hard Currency were also especially strong areas for active managers.
Source: FinXL
It’s worth noting that the IA UK All Companies sector – one of the largest peer groups but one that has been unloved for some time – has made it onto this list as two-thirds of its active members beat the index last year,
Those outpacing their benchmark by the widest margin were Baillie Gifford UK Equity Focus, MI Chelverton UK Equity Growth, Premier Miton Ethical, Scottish Friendly UK Growth and Premier Miton UK Growth.
But the IA Global sector – which has been very popular with investors over recent years – failed to make the table. Some 54.4 per cent of its active funds were ahead of their benchmarks in 2020.
Baillie Gifford Long Term Global Growth Investment offered the strongest outperformance in this peer group – it’s 95.62 per cent total return was 83.19 percentage points ahead of its FTSE All World benchmark.
Baillie Gifford Positive Change, Guinness Sustainable Energy, Baillie Gifford Global Stewardship and PGIM Jennison Global Equity Opportunities were next best.
However, there were six Investment Association sectors where the majority of active funds did not beat their benchmark last year.
The worst offender was IA Global Equity Income, where only 20.5 per cent of members outperformed. The IA UK Direct Property, IA UK Equity Income, IA Sterling High Yield, IA North America and IA Mixed Investment 20-60% Shares sectors also offered a lacklustre year for active investors as more than half of their members did not beat the benchmark.
That said, the IA North America sector is home to the fund that outperformed its benchmark by the greatest margin. Baillie Gifford American was 107.72 percentage points ahead of the S&P 500 with its total return of 121.84 per cent – the highest return of the entire Investment Association universe for 2020.
Source: FinXL
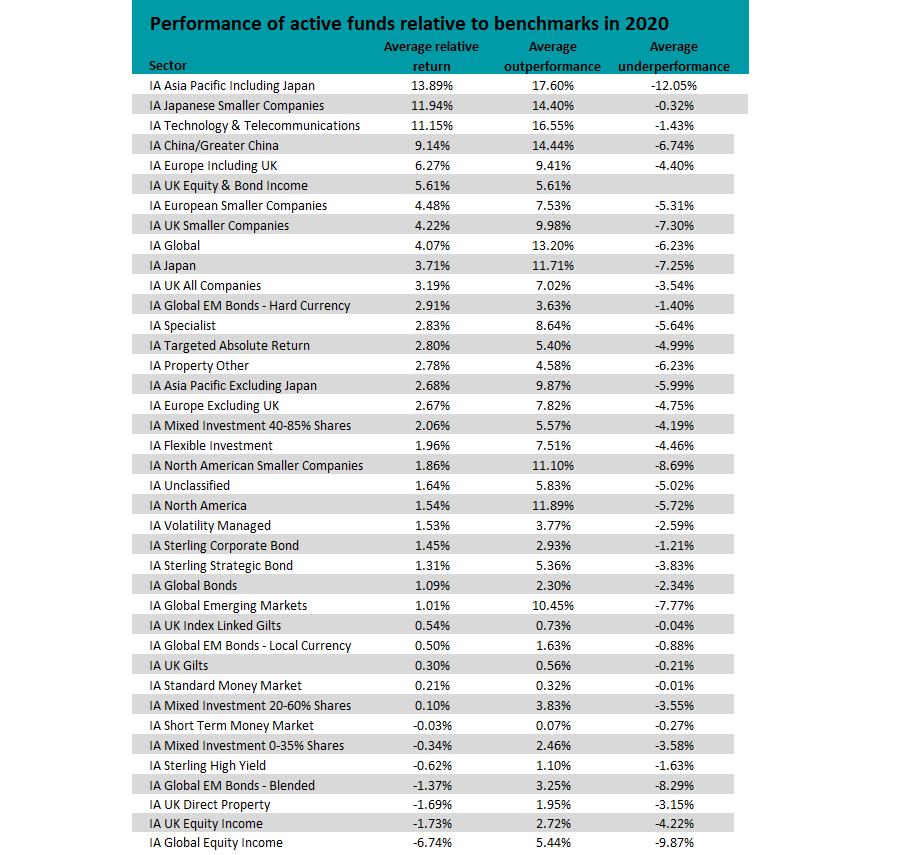
Of course, the number of outperforming active funds might matter very little if they only beat the index by a couple of basis points. The above table shows the average level of outperformance or underperformance in each sector, along with the relative return of the average outperforming and underperforming funds – so what extent they beat the index or trailed it.
IA Asia Pacific Including Japan sits at the top after the average active fund outpaced their benchmark by 13.89 percentage points last year. The average outperformer ended 2020 some 17.60 percentage points higher than the index, while the average underperformer lagged behind it by 12.05 per cent.
The IA Japanese Smaller Companies and IA Technology & Telecommunications sectors are among those that proved to be especially fruitful areas for active managers, as the outperformers exceeded the index by a significant margin while the laggards weren’t that far behind.
On the other hand, areas like IA Global Equity Income, IA UK Equity Income and IA UK Direct Property, which were among the hardest hit by the coronavirus crisis, saw their average fund fall behind the benchmark for the year.