


While investors who have only been following the market for the past 10 or so years might think the growth style is the default investment winner, managers at Fidelity argue that history paints a very different picture.
Much of the recent narrative has focused on if growth or value investing will maintain market leadership. While the growth style dominated for much of the past decade, it slipped last year after central banks hiked interest rates.
This has led to discussion whether markets are entering a ‘new normal’ of higher inflation and interest rates, which would favour value stocks, or if 2022 was something of a blip and growth will continue to outperform over the long run.
But a note from Fidelity’s Rosanna Burcheri, Fiona Stubbs and Ashish Bhardwaj argues value has been the dominant investing style of the past century - it is the past decade which should be seen as the blip.
“The logic of ‘value’ investing has always sounded strong. Intuitively, it makes sense: pick companies that are well run, with a strong business model, but currently priced below their long-term potential and somewhere down the line you should be able to realise their fair value,” they said.
“The last decade has punched a hole in that proposition, if not the logic behind it, as investors massively prioritised ‘growth’ stories over value in an environment of ultra-cheap leverage.”
Returns of US stocks by decade: lowest vs highest price-to-book valuation
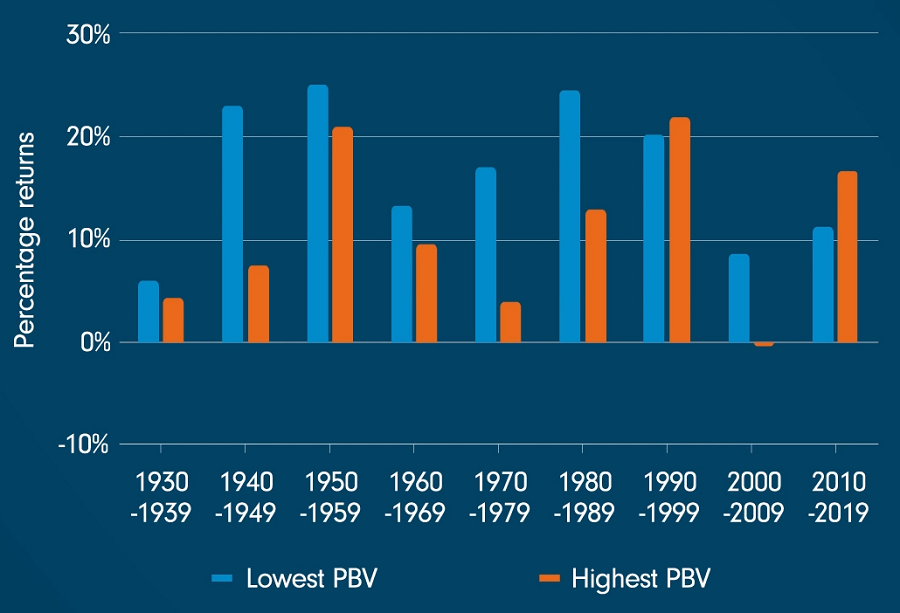
Source: Fidelity International, from UBS Quant, Aswath Damodaran’s ‘Where is the ‘value’ in value investing?’
However, they pointed to the above chart as evidence that value investing has a long-term appeal if investors widen their horizon to further out than just the post-global financial crisis period.
It shows that value investing has historically outperformed growth strategies in every decade since the 1930s, with only two notable exceptions: the 'dotcom boom' era of 1990s and the 2010s, characterised by ultralow rates.
A retrospective glance at US stock performance by decade from 1930 to 2020 reveals that stocks with the lowest price-to-book (PB) ratios made 5.22 per cent more per year, on average, than those with the highest PB ratios.
Burcheri, Fiona and Bhardwaj pointed out that the outperformance of growth stocks has typically been tied to the emergence of significant, unforeseen growth drivers. Once these factors become well-understood and speculation takes hold, growth stocks begin to be re-rated at a substantial premium to the market.
This valuation, however, often cannot be justified by their future growth potential, leading to periods of what can be called "speculative outperformance". This pattern was prevalent during the dotcom boom of the 1990s and again from 2016 to 2020.
After this, each growth cycle subsequently ushers in a third phase of reality-check, where a return to fair value ensues. Historical periods of Nasdaq outperformance show that this third phase typically lasts five or six years, mirroring the time taken by the market to assimilate changing fundamentals in old growth drivers and for new growth drivers to emerge.
“It’s important to emphasise the above timelines are purely illustrative based on past market performance. But all of this of course chimes well with Business 101: new businesses emerge, they develop, they capture a dynamically expanding market before settling in to cash-cow mode, whereupon more competition arrives and their first-mover edge evaporates,” they said.
“Looking at streaming, or cloud services, or social networking, you might well think there is a lot of new competition homing in on many of the big corporate success stories of the past decade. And no doubt we’re searching for the next drivers of growth, be it AI, green tech or the metaverse, to name a few current candidates.”
While this is playing out, the Fidelity managers finished, the market reaches a state of equilibrium where all boats cease to rise. In this environment, investors often turn to value opportunities as are driven less by macro variables like interest rates and more by comprehensive fundamental analysis.
Performance of fund vs sector and index over 10 years
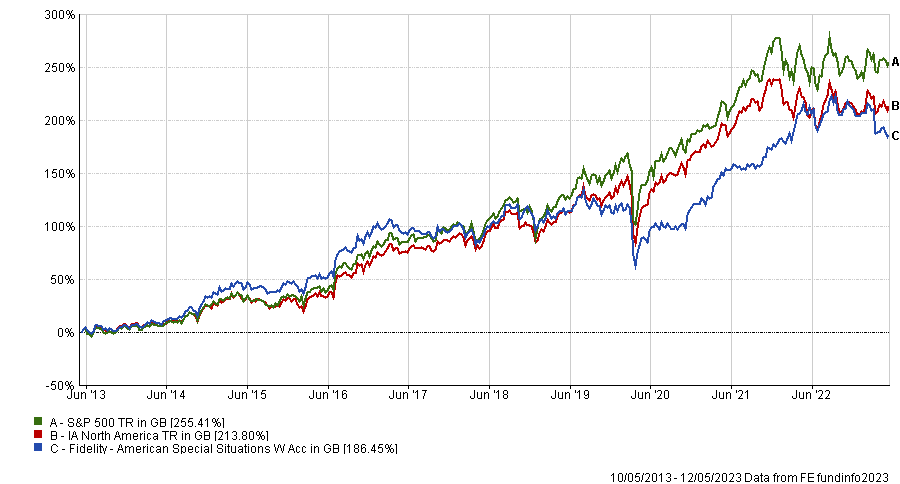
Source: FE Analytics
FE fundinfo Alpha Manager Burcheri is lead manager of the £696m Fidelity American Special Situations fund, with Bhardwaj as deputy.
The fund is bottom quartile in the IA North America sector over 10 years with a 186.5% total return, reflecting the fact that the market has been led by growth stocks for the vast majority of the period.
However, it can surge to the top of the performance tables when value investing is on the rise – it made 8.2% in 2022, putting it in the top quartile of the sector when its average peer dropped 9.7% on the back of the sell-off in growth stocks.