The UK market is now perceived riskier than ever, so much so that some commentators are comparing its behaviour to that of an emerging market.
Some have suggested that the UK market is under-priced, making it attractive for potential future returns, but these views seem to be scaling back while others are outright pessimistic.
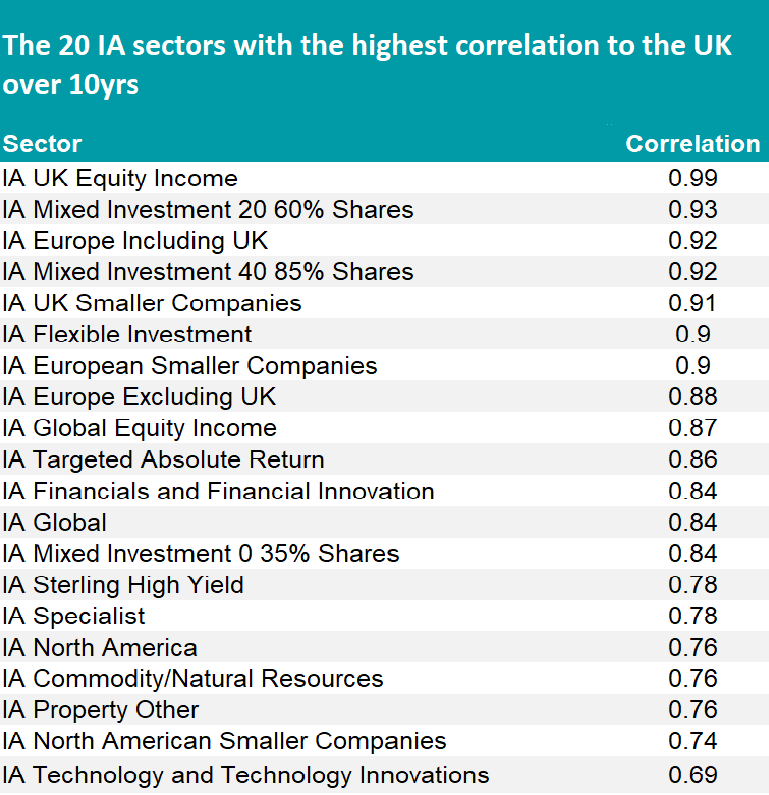
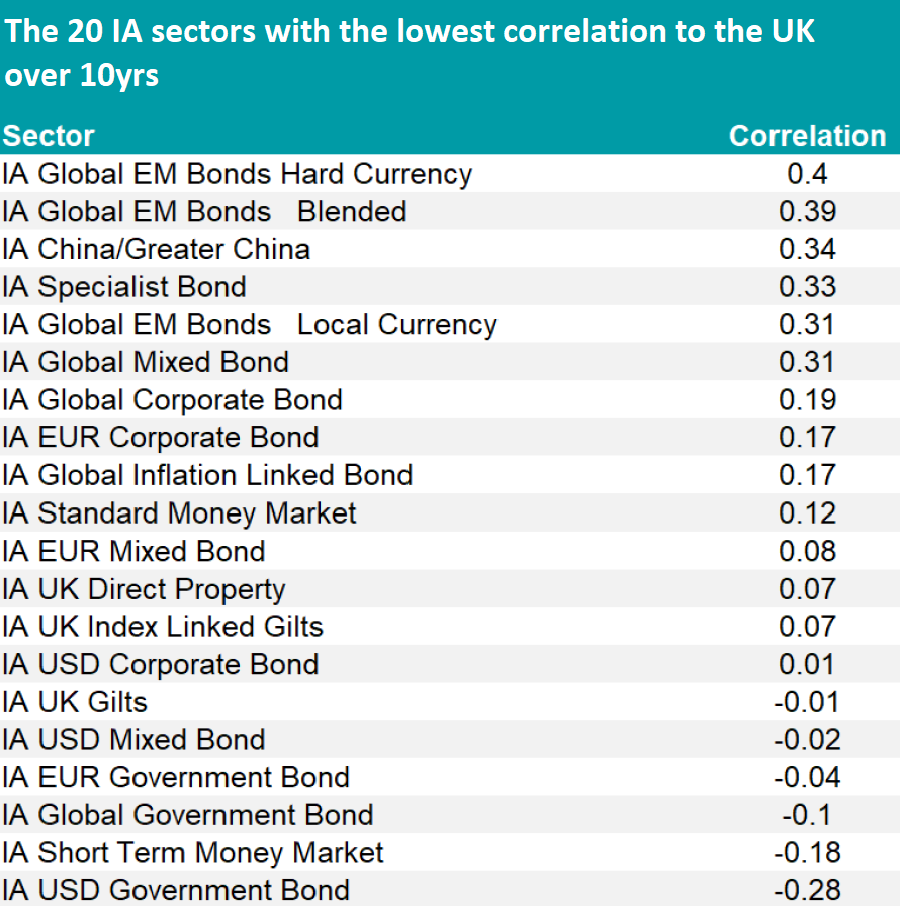
If you are worried about the amount of exposure you have to the UK against the current backdrop, Trustnet had a look at which Investment Association (IA) sectors have the highest and lowest correlation to IA UK All Companies in the past 10 years.
Or, in other words, the sectors whose performances has moved in parallel – or in the opposite direction – to UK equities.

Source: FE Analytics
Sitting at the top of the table, with a 99% correlation, is the IA UK Equity Income sector – closely followed by other UK-based groups such as IA Europe Including UK (92%) and IA UK Smaller Companies (91%).
European and global strategies also seem highly correlated to UK All Companies, with mixed investment sectors at 93% and IA Europe Excluding UK at 88%. IA Global and IA North America are at 84% and 76%, respectively.
The middle ground (between 30% and 60%) is dominated by specialist sectors and emerging markets.
Thematic approaches such as technology, healthcare and infrastructure all gravitate towards the mid-table, with both IA Technology and Technology Innovations and IA Infrastructure at 69% and IA Healthcare with a lower 52%.
One notable exception is IA UK Direct Property, which only exhibited 7% correlation.

Source: FE Analytics
Within emerging markets, the least correlated to the UK was IA China/Greater China, which followed the same performance pattern as the UK only 33% of the time in the past 10 years. Japanese smaller companies and the Indian subcontinent were not far behind at 45% and 48% respectively.
At the foot of the table, with the most divergent performance to UK All Companies, sit global government bonds (-4%), of which UK gilts remained at -1%, European ones at -4%, and US bonds closing the table with the highest negative correlation, -28%.
Despite this seemingly obvious diversification between equities and bonds, Suhail Shaikh, chief investment officer of Fulcrum Asset Management, said that the 60% equity and 40% bond portfolios that have been a staple for investors no longer applied.
According to a survey by the firm, two-thirds of investors (64%) thought that it was no longer fit for purpose, a view he echoed.
“As well as traditional asset classes, such as equities and bonds, we think it is important to be invested in a wide variety of uncorrelated return streams,” he said.


