


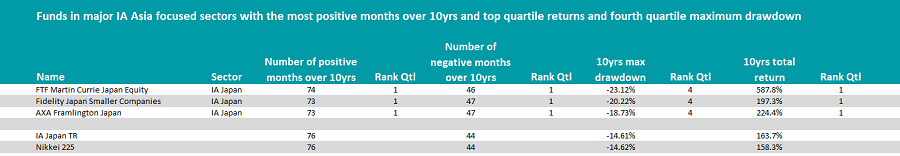
Only three funds out of five Asia equity sectors delivered top-quartile returns over the past decade while undergoing the biggest losses in their sectors.
In this series, Trustnet looks at which funds have been top-quartile for both returns and number of positive months over 10 years but have the biggest largest maximum drawdowns in its sector.
Down periods and times where returns lag are a daily risk for investors but, as this data shows, for those willing to see out the wobbles there can high rewards.
Trustnet previously looked at the major UK equity and global sectors. This time the study is focused on Asian sectors, specifically: IA Asia Pacific ex Japan, IA Asia Pacific inc Japan, IA China/Greater China, IA Japan and IA Japanese Smaller Companies.
Source: FE Analytics
*Nikkei 225 is used as a comparison for all funds on the list
Out of the five sectors only three funds from the IA Japan sector made the list: AXA Framlington Japan, Fidelity Japan Smaller Companies, FTF Martin Currie Japan Equity.
Darius McDermott, managing director of FundCalibre, explained that the Japanese market in particular tends to be very stylistic with strong rotations between growth and value which can result in “very severe drawdowns” for funds which have a very strongly defined style.
McDermott said: “It is not unusual to find a value style fund up 20% in one year whilst the growth fund is down 20% or vice versa.”
All three have a small-cap bias, which according to McDermott is expected given that small-caps can generate higher returns, although they are more risky during periods of market stress.
FTF Martin Currie Japan Equity
Looking at FTF Martin Currie Japan Equity first, it had the most positive months in the study, 74 out of a possible 120. Its maximum drawdown was 23.1%.
The fund was previously called Legg Mason IF Japan Equity Fund but underwent a name change following Franklin Templeton’s acquisition of Legg Mason earlier this year.
FTF Martin Currie Japan Equity is “famously volatile,” according to McDermott, with 22.6% volatility over 10 years. “It is probably the most volatile unlevered UCITs equity fund available to buy.”
“It's an ultra aggressive growth fund with a clear emphasis on the future and heavy bias to smaller companies,” McDermott said.
This overweight to growth has contributed to the “massive drawdowns” the fund has undergone when the Japanese market has rotated out of growth and into value.
“Following the tech bubble the fund lost over 66% over the next three years. Then between 2006 and the end of 2008 the fund suffered a 79% drawdown,” McDermott said. And after the Great Financial Crisis it “did not recover quickly”.
But, despite the massive amounts of volatility “patient investors who have been able to stomach the roller coaster ride have achieved some exceptional returns,” McDermott said.
Its returns over 10 years were 587.8%, the highest in the entire IA Japan sector.
Performance of fund vs sector and benchmark over 10yrs
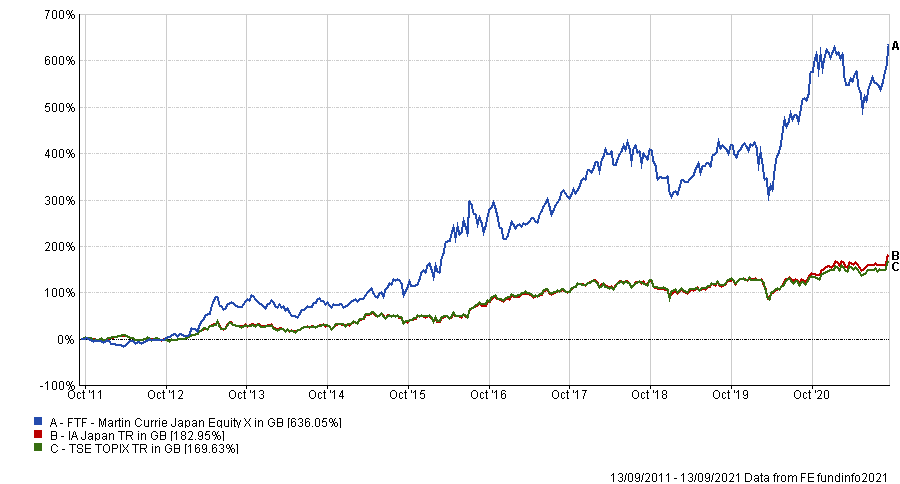
Source: FE Analytics
The fund’s focus on the ‘future’ refers to FE fundinfo Alpha Manager Hideo Shiozumi’s investment in the structural and social themes causing change in Japan, creating what he calls a ‘New Japan’. These include: an aging population, changing consumer lifestyles and internet empowerment.
As a result the £1.4bn fund has a high exposure to industrials, healthcare, telecom, media and technology, with gaming company Nintendo, healthcare services company M3 inc and photograph supply company, Fujifilm, all featuring in the top 10 holdings.
Coming out of the pandemic, Shiozumi added another layer focusing on domestic-oriented sectors he thinks will majorly benefit from ‘workstyle reforms’ which have appeared during Covid.
Fidelity Japan Smaller Companies
Next is Fidelity Japan Smaller Companies, which had 73 positive periods and a maximum drawdown of 20.2%.
Over 10 years it made 197.3%, a top 10 performer in the sector during that time. Its 10-year cumulative volatility was 14%.
Performance of fund vs sector and benchmark over 10yrs
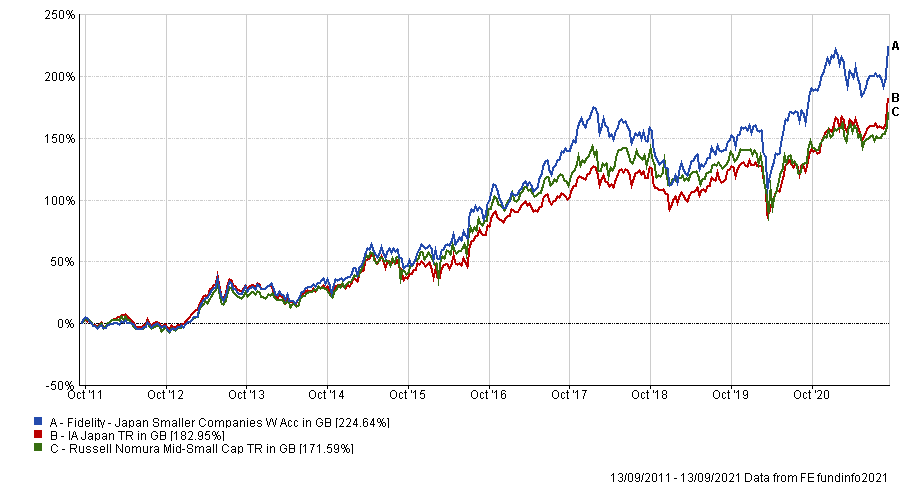
Source: FE Analytics
The Fidelity International fund group has a strong grounding in Japan and manager, Jun Tano, is able to take advantage of that support. The £98m fund also invests in small-caps, but can take some mid-cap exposure.
Tano’s focus on bottom-up stock picking is underlined by a ‘blended’ approach, not focusing on just growth or value specifically, rather companies that can build and sustain profit growth long-term.
The fund has an FE fundinfo Crown rating of four.
AXA Framlington Japan
Last up is AXA Framlington Japan, which like the previous fund had 73 out of a possible 120 positive months, but with a maximum drawdown of 18.7%, the best in the study. Its total return over 10 years was 224.4%, the sixth best during that timeframe.
Performance of fund vs sector and benchmark over 10yrs
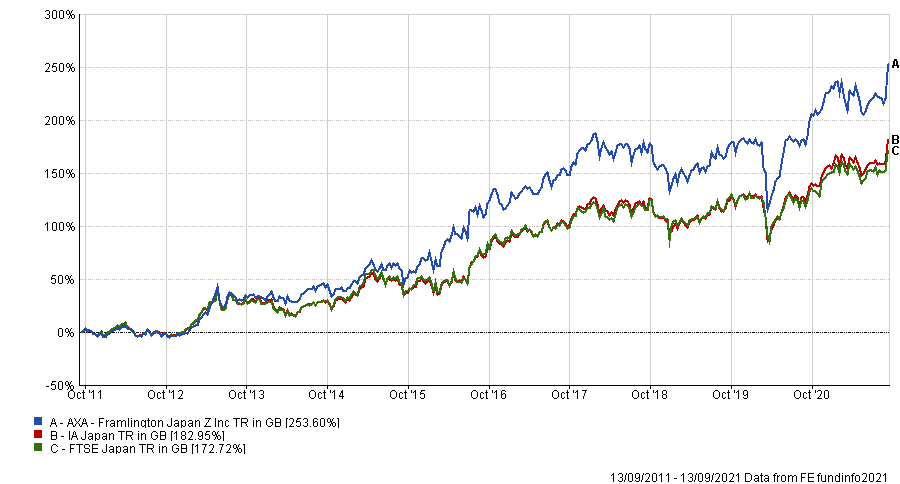
Source: FE Analytics
Although it can invest across the market-cap space it focuses more on risky small-caps, which consequently increases its volatility, McDermott said. Its volatility over 10 years was 14.3%.
FundCalibre said, that lead manager Chisako Hardie and deputy manager Tom Riley typically favoured growth, but they had a valuation discipline in their process meaning that the fund’s style bias was less extreme than some of its peers.
A consequence of this valuation discipline is that the managers sell out of companies when they become ‘fully valued’.
As part of this process the fund looks for long-term structural growth companies within thematic trends, such as the globalisation of Japanese food, ageing populations, automation and the increased use of electronics in cars.