


Although 2021 started with value stocks surging and growth stocks falling behind in the ‘re-opening trade’, the second quarter of the year has seen this trend start to come apart, FE fundinfo data shows. 
The past three months have been decent ones for risk assets with equities and commodities moving higher, although scratch below the surface and a much more nuanced picture emerges.
In the following article, Trustnet presents 10 charts to help offer greater understanding of what moved the market over 2021’s second quarter.
Asset classes
Positive investor sentiment over the quarter meant that stocks had a decent run, with the MSCI AC World index gaining more than 7 per cent (in sterling terms).
While global equities lost some ground in May, June was a robust month with the MSCI AC World climbing 4.26 per cent. Investors seem bullish, although the market is closely watching the race between new Covid variants and the vaccine roll-out.
Performance by asset class in Q2 2021
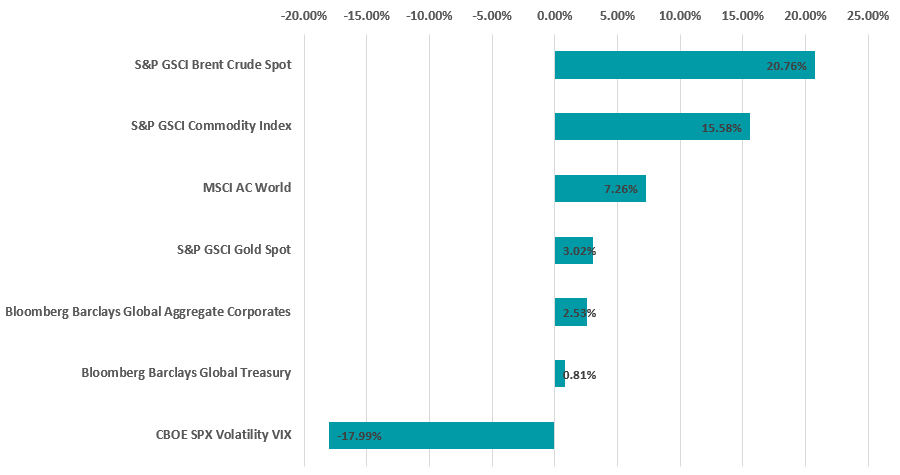
Source: FinXL
Fawad Razaqzada, market analyst at ThinkMarkets, said: “As we begin the third quarter, the attention was once again on lifting of lockdown measures around the world versus growth of new variants of Covid-19, especially the most infectious, Delta.
“Overall, sentiment towards risk was still very positive as the S&P 500 hit repeated new all-time highs to end Q2. Investors hoped that the acceleration of Covid vaccinations around the world would keep the virus at bay and allow the global economy to grow strongly.”
However, the big gains were seen in commodities – which are experiencing a surge in demand as the global economy unlocks from the coronavirus pandemic.
Oil was a strong gainer, with Brent rising more than 20 per cent. But other energy commodities also had a strong month – natural gas was up 33 per cent and petroleum rose 21 per cent.
Caffeine fans might also take note that coffee prices climbed 25 per cent and sugar rose 20 per cent.
Region
The US’ S&P 500 ended the second quarter as the best performing major regional market, setting several new all-time highs as its recovery from the pandemic progressed.
However, Europe had been in first place for most of the quarter. Europe had benefitted from the re-opening/reflation trade that has pushed cyclical stocks higher; however, this reversed June and growth stocks – which Europe is relatively light on but the US is a prime hunting ground – staged a strong comeback.
Performance by region in Q2 2021
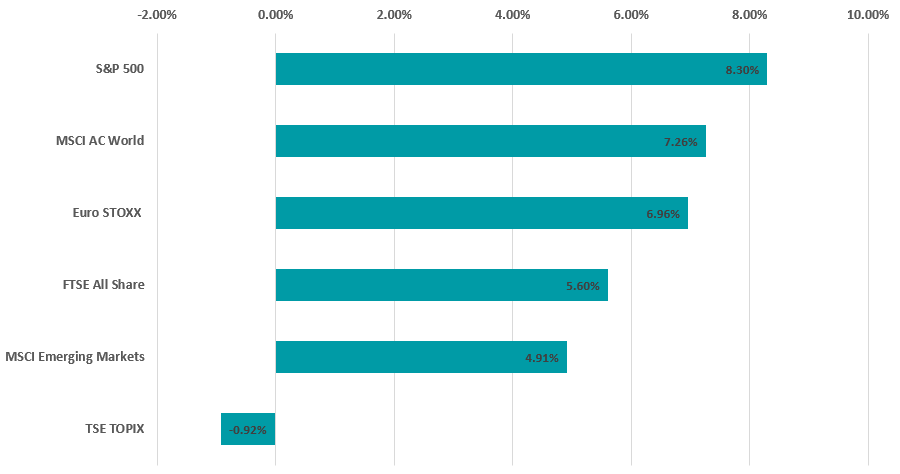
Source: FinXL
The UK underperformed global, US and European stocks. The FTSE All Share had made good progress in April and May, but rose just 0.16 per cent in June and fell far behind other markets
Japan was the worst performing region of the quarter, as the country was hit by the Delta variant and introduced some quasi-emergency measures to stem its spread.
Investment style
The below chart highlights a big shake-up that occurred in markets during the second quarter – the value-led ‘re-opening trade’ that started in November 2020 following the announcement of effective coronavirus vaccines started to weaken.
Performance by investment style in Q2 2021
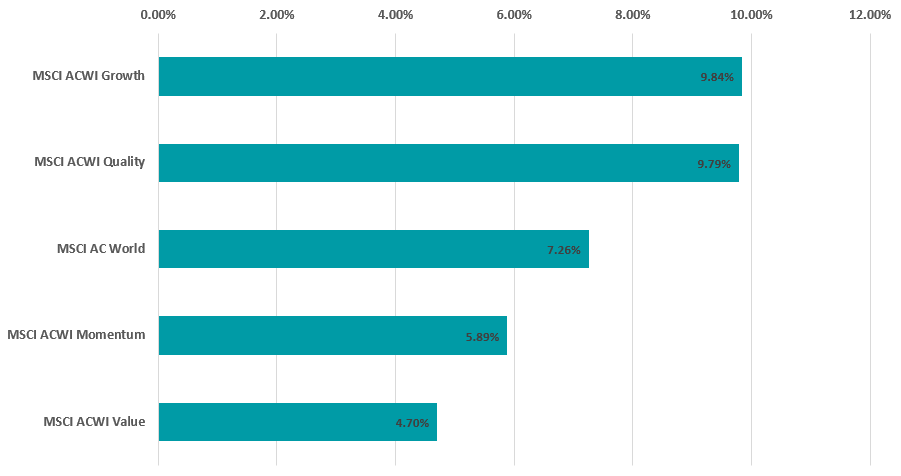
Source: FinXL
As can be seen, growth stocks – which had led the market for more than a decade but struggled when the global re-opening promised higher growth and inflation rates – outpaced value in the second quarter.
Value stocks, which tend to do better than growth when the economy is stronger, lagged behind by a wide margin in April and June. They did outperform in May, when concerns over higher inflation prompted a sell-off in growth areas like tech.
Performance by investment style in Apr, May and Jun 2021
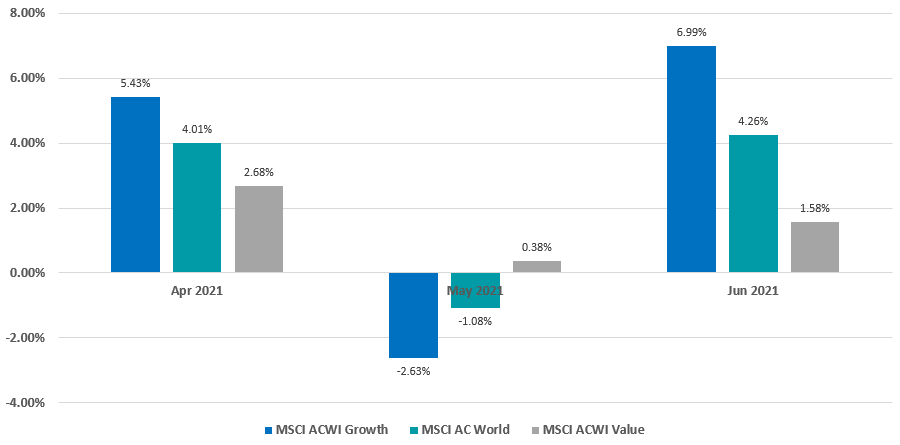
Source: FinXL
Market cap
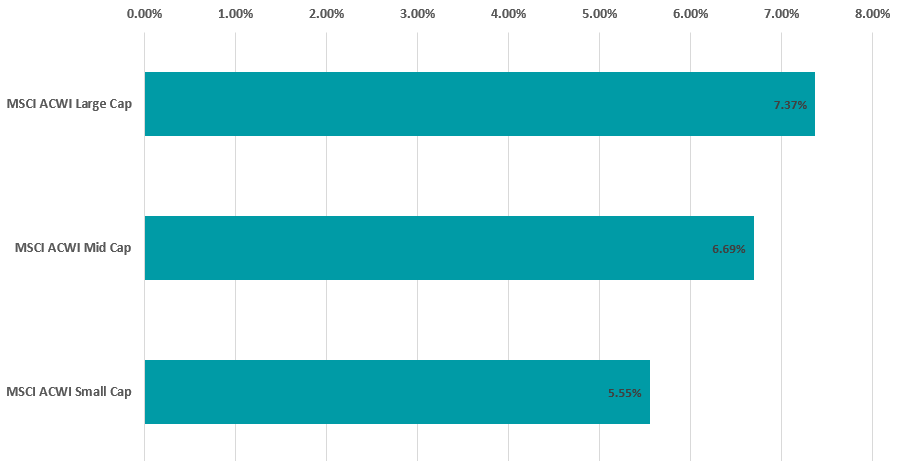
There was also somewhat of a reversal in performance by market cap. The promise of stronger economic growth on the back of the vaccine rollout had meant smaller companies were outpacing large-caps in the opening months of 2021.
Performance by MSCI ACWI market cap in Q2 2021
Source: FinXL
However, as the chart above shows, the second quarter of 2021 saw investors prefer large-cap stocks over small-caps.
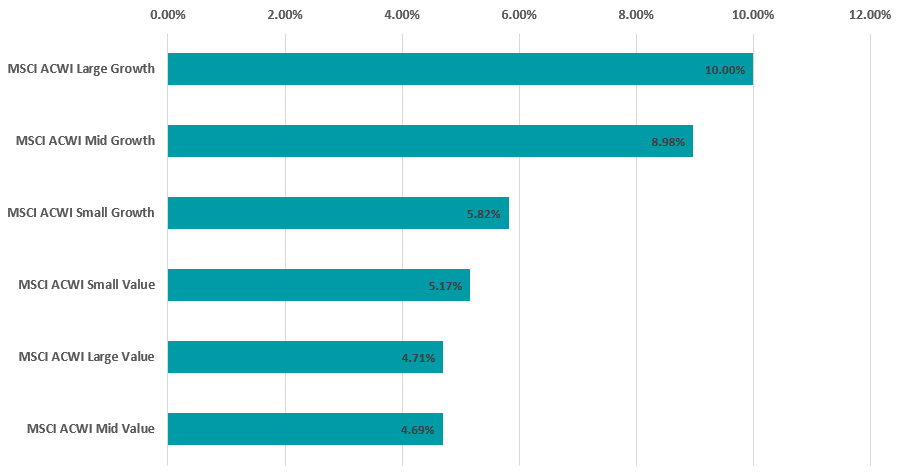
When combined with the change in investment style preference highlighted above, this meant that large-cap growth stocks were the best performers over the last three months.
Performance by MSCI ACWI market cap and investment style in Q2 2021
Source: FinXL
Small-cap value had been the place to be in 2021’s first quarter but lost ground to growth stocks more recently. That said, the small-cap value index did better than its large- and mid-cap peers.
Industry
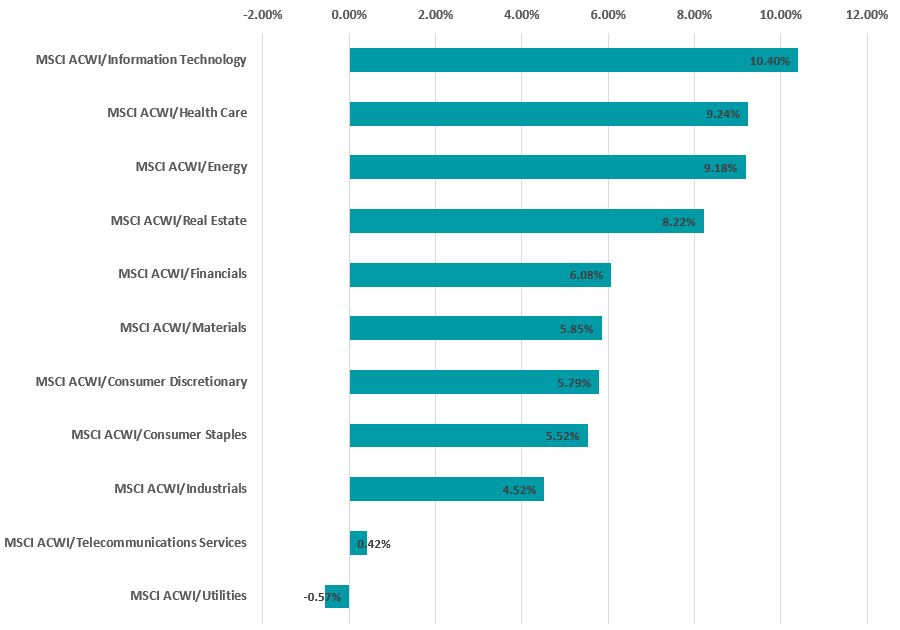
Looking at markets from an industry point of view shows a bit of a mixed bag.
Tech stocks led the way over the three-month period, despite falling 3.5 per cent in May on the back of inflation worries. However, they more than made up for this with a 9 per cent gain in June.
Performance by MSCI ACWI industry in Q2 2021
Source: FinXL
It wasn’t only the growth sectors that did well, however. Energy stocks – seen as a classic value/cyclical play – weren’t too far behind tech thanks to the strong gains being made by oil and other commodities over the quarter.
Fund sectors
Finally, the following charts show how all of the above combined to impact fund returns over 2021’s second quarter.
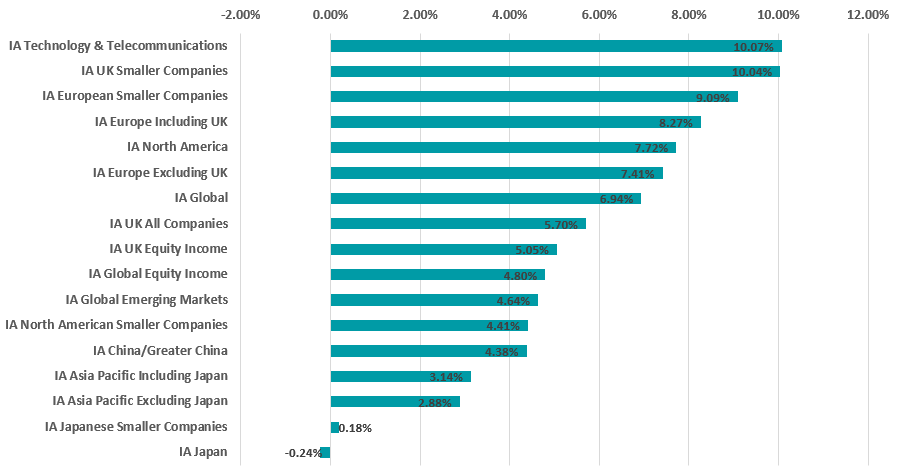
Performance by IA equity fund sector in Q2 2021
Source: FinXL
In the equity peer groups, tech funds and UK smaller companies were neck and neck with average returns of around 10 per cent. European equity strategies followed close behind.
The rear was brought up by the Japanese equity sectors, with the wider Asia Pacific region also struggling.
Performance by IA bond fund sector in Q2 2021
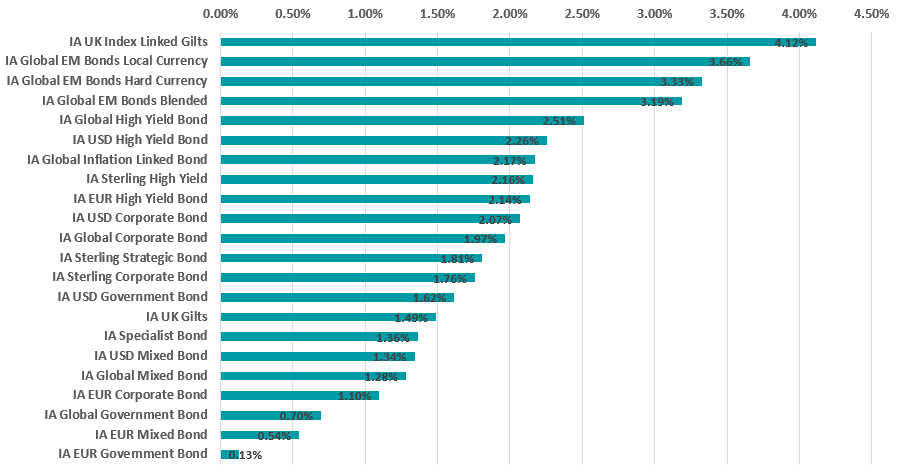
Source: FinXL
Over in fixed income land, rising inflation meant that IA UK Index Linked Gilts was the quarter’s top performing sector.
A general ‘risk-on’ mindset also meant that emerging market debt and high yield funds outperformed conventional government bonds.
Performance by IA multi-asset fund sector in Q2 2021
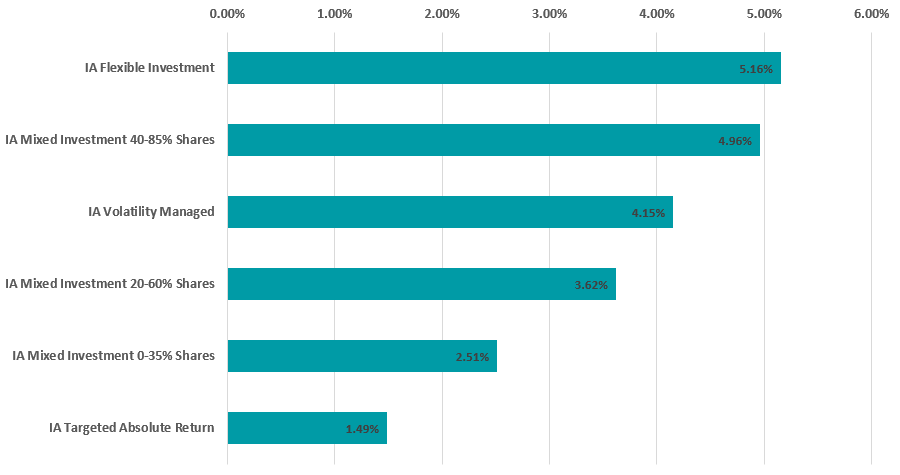
Source: FinXL
In the multi-asset sectors, those with a higher allocation to equities – such as IA Flexible Investment and IA Mixed Investment 40-85% Shares – made the highest returns.
Absolute return funds put in the weakest showing, reflecting the fact that quarter was relatively calm on the whole with volatility falling.